Credit: Ayushi Kachhara NIWA 2018
This describes how large numbers of different data sets can be effectively pooled to group marine species into 'community assemblages'. These assemblages can be used to identify biodiversity hotspots and explore trade-offs resulting from management decisions.
Aotearoa New Zealand’s waters cover a vast area, 4.1 million km2, most of which is deep sea.
While many coastal areas and some offshore areas like the Chatham Rise have been well characterised, large parts of the EEZ (exclusive economic zone) remain unsampled as marine surveys in deep, offshore habitats are logistically difficult and expensive.
The lack of comprehensive information about what species are where, and in what numbers, makes it difficult to:
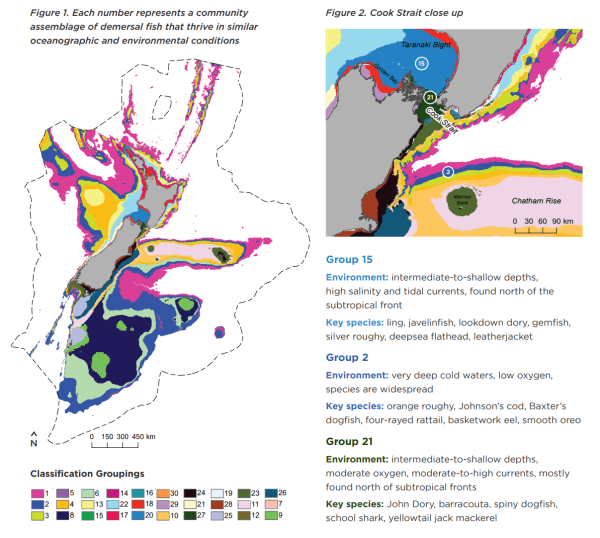
We used a Gradient Forest model to accurately model how 253 species of bottom-feeding (demersal) fish species were grouped together over a range of environments within the New Zealand Continental Shelf Zone to depths of 2,000 m.
The model pooled a large number of existing data sets, combining environmental information with demersal fish occurrence records (data of where a species has/has not been found). It then grouped fish species according to the oceanographic and environmental conditions in which they live – ie species that tend to be found in the same habitats (eg cold, deep water) at the same time.
We used these groups, or ‘community assemblages’, as a proxy to estimate patterns of species diversity in inaccessible areas – using information from common species to ‘fill the gaps’ where data was limited for less common species.
We validated the model with independent data, which showed it was very robust at predicting patterns of species composition (species that make up the community assemblage) and turnover (the change in species composition over space).
We, jointly with a NIWA project, then used our 30 demersal fish community assemblages to determine optimal locations for biodiversity conservation, and to explore trade-offs between resource use and biodiversity conservation.
Summary of the research
Advantages of this approach